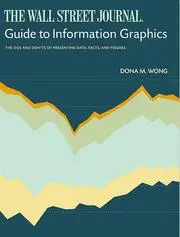
The Wall Street journal guide to information graphics
Dona M. Wong · 2010
Writing, design and web craft › Data visualization and visual communication
#7,667 most recommended
Hacker News
6
mentions by 4 people · top 42% of 15,732 books
Open Library
5.00★★★★★★★★★★
1 rating · 39 want to read
Wikipedia
—
No article yet
About the book
A practical reference on designing charts, maps, tables and other information graphics for print and screen, drawn from the graphics work of The Wall Street Journal. It covers the common chart types and how to choose one that fits the data and the question a reader is likely to ask, along with the layout, labelling, scale and colour decisions that shape how a graphic is read. Wong's central claim is that a graphic's job is to show data clearly and accurately, so design choices should serve comprehension rather than decoration. Through a series of do's and don'ts, she argues that distorted scales, misleading proportions, decorative clutter and unnecessary complexity impair understanding, while direct labels, consistent encoding and a chart type matched to the message help readers grasp the point quickly. She illustrates these principles with examples from newspaper and business reporting to show they hold under tight deadlines and limited space.
Written by Claude from what it knows of this book.
What Hacker News says 100% recommend · 0% critical
In the commenters’ own words
I do a lot of charting for financial services software. The best practical book that I've found is The Wall Street Journal Guide to Information Graphics: The…
99% of the time it is design, 1% it is art. The goal is always to convey information in a digestible way without being misleading. An example of it being art…
What Open Library readers say 5.00 from 1 rating
- 51
- 40
- 30
- 20
- 10
- 39 want to read
- 1 reading
- 2 have read
Only 1 rating: treat the average as a hint.
What critics say, via Wikipedia
No Wikipedia article about this book yet, so no critics to quote.
Reddit communities — coming later
The threads it came up in
Details
- First published
- 2010
- ISBN
- 9780393347289
- Editions known
- 2 at Open Library
- Open Library
- OL13856603W
Read next: its neighbours on the mosaic
 The Visual Display of Quantitative InformationEdward R. Tufte · 1983 · recommended by 100 people · similar by subject and what people say about it
 Information Dashboard DesignStephen Few · 2006 · recommended by 25 people · similar by subject and what people say about it
 Information GraphicsRobert L. Harris · 1999 · recommended by 3 people · similar by subject and what people say about it
 Good chartsScott Berinato · 2016 · recommended by 1 person · similar by subject and what people say about it
 The grammar of graphicsLeland Wilkinson · 1999 · recommended by 16 people · similar by subject and what people say about it
 Better Data Visualizations - a Guide for Scholars, Researchers, and WonksJonathan A. Schwabish · 2021 · recommended by 2 people · similar by subject and what people say about it
 Readings in information visualizationStuart K. Card · 1999 · recommended by 2 people · similar by subject and what people say about it
 Envisioning InformationEdward R. Tufte · 1990 · recommended by 31 people · similar by subject and what people say about it
 Storytelling with DataCole Nussbaumer Knaflic · 2015 · recommended by 6 people · similar by subject and what people say about it
 How Charts LieAlberto Cairo · 2019 · recommended by 5 people · similar by subject and what people say about it
 Show Me the NumbersStephen Few · 2004 · recommended by 4 people · similar by subject and what people say about it
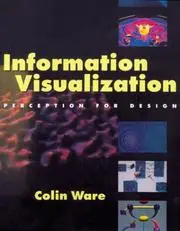 Information visualizationColin Ware · 2000 · recommended by 3 people · similar by subject and what people say about it
 Information is BeautifulDavid McCandless · 2010 · recommended by 0 people · similar by subject and what people say about it
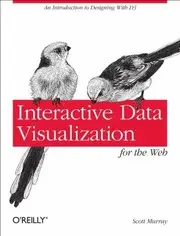 Interactive Data Visualization For The WebScott Murray · 2013 · recommended by 3 people · similar by subject and what people say about it
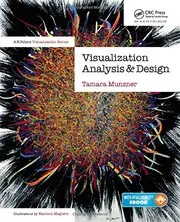 Visualization Analysis and DesignTamara Munzner · 2014 · recommended by 6 people · similar by subject and what people say about it
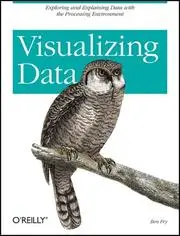 Visualizing DataBen Fry · 2008 · recommended by 7 people · similar by subject and what people say about it
 Visual ExplanationsEdward R. Tufte · 1997 · recommended by 11 people · similar by subject and what people say about it
 Beautiful EvidenceEdward R. Tufte · 2006 · recommended by 8 people · similar by subject and what people say about it
 Now you see itStephen Few · 2009 · recommended by 2 people · similar by subject and what people say about it
 The elements of graphing dataWilliam S. Cleveland · 1985 · recommended by 6 people · similar by subject and what people say about it
 The cartoon guide to statisticsLarry Gonick · 1993 · recommended by 17 people · similar by subject and what people say about it
 Designing with the Mind in MindJohnson, Jeff · 2010 · recommended by 10 people · similar by subject and what people say about it
 Visualizing dataWilliam S. Cleveland · 1993 · recommended by 2 people · similar by subject and what people say about it
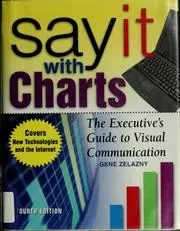 Say it with chartsGene Zelazny · 2001 · recommended by 3 people · similar by subject and what people say about it