
Now you see it
Stephen Few · 2009
Writing, design and web craft › Data visualization and visual communication
#7,296 most recommended
Hacker News
5
mentions by 5 people · top 48% of 15,732 books
Open Library
4.00★★★★★★★★★★
1 rating · 61 want to read
Wikipedia
—
No article yet
About the book
This book covers the visual display of quantitative data for analysis, mainly in business and other organizational settings. It focuses on simple graph types for showing comparisons, time series, distributions, and relationships between variables, and on the techniques used to build them. Few argues that people find patterns, exceptions, and relationships in data more reliably through well-designed visual displays than through tables or decorative charts. He claims that the choice of graph should follow from the analytical question and from what the eye perceives most readily. He also holds that simple techniques, such as highlighting, sorting, and careful scaling, usually reveal more than elaborate or three-dimensional graphics do.
Written by Claude from what it knows of this book.
What Hacker News says 40% recommend · 0% critical
In the commenters’ own words
Hi Hacker News Austinites, I have some hardware that's languishing in storage. I've gotten 1000's of hours of entertainment from the high quality community…
Information Dashboard Design - is definitely the first one you should read. It really gives a more high level overview of charting best practices and…
What Open Library readers say 4.00 from 1 rating
- 50
- 41
- 30
- 20
- 10
- 61 want to read
- 8 reading
- 1 have read
Only 1 rating: treat the average as a hint.
What critics say, via Wikipedia
No Wikipedia article about this book yet, so no critics to quote.
Reddit communities — coming later
The threads it came up in
Details
- First published
- 2009
- ISBN
- 9780970601988
- Editions known
- 4 at Open Library
- Open Library
- OL15588940W
ComputersDatenanalyseDatenauswertungElectronic data processing, managementGraphic methodsGraphische DarstellungIndustrial managementInformation visualizationQuantitative researchStatisticsStatistikTk7882.i6 f48 2009
Read next: its neighbours on the mosaic
 Show Me the NumbersStephen Few · 2004 · recommended by 4 people · similar by subject and what people say about it
 Envisioning InformationEdward R. Tufte · 1990 · recommended by 31 people · similar by subject and what people say about it
 Information Dashboard DesignStephen Few · 2006 · recommended by 25 people · similar by subject and what people say about it
 The Visual Display of Quantitative InformationEdward R. Tufte · 1983 · recommended by 100 people · similar by subject and what people say about it
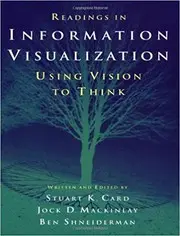 Readings in information visualizationStuart K. Card · 1999 · recommended by 2 people · similar by subject and what people say about it
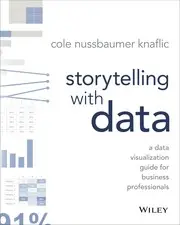 Storytelling with DataCole Nussbaumer Knaflic · 2015 · recommended by 6 people · similar by subject and what people say about it
 Information is BeautifulDavid McCandless · 2010 · recommended by 0 people · similar by subject and what people say about it
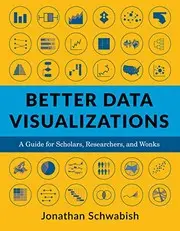 Better Data Visualizations - a Guide for Scholars, Researchers, and WonksJonathan A. Schwabish · 2021 · recommended by 2 people · similar by subject and what people say about it
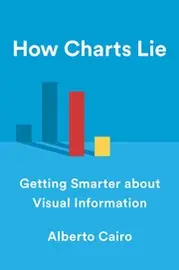 How Charts LieAlberto Cairo · 2019 · recommended by 5 people · similar by subject and what people say about it
 The grammar of graphicsLeland Wilkinson · 1999 · recommended by 16 people · similar by subject and what people say about it
 Visualizing DataBen Fry · 2008 · recommended by 7 people · similar by subject and what people say about it
 Information visualizationColin Ware · 2000 · recommended by 3 people · similar by subject and what people say about it
 Visual ExplanationsEdward R. Tufte · 1997 · recommended by 11 people · similar by subject and what people say about it
 Wall and PieceBanksy · 2005 · recommended by 0 people · loosely similar by subject
 Good chartsScott Berinato · 2016 · recommended by 1 person · similar by subject and what people say about it
 Visual thinkingRudolf Arnheim · 1969 · recommended by 4 people · similar by subject and what people say about it
 Visual thinking for designColin Ware · 2008 · recommended by 2 people · similar by subject and what people say about it
 Visualizing dataWilliam S. Cleveland · 1993 · recommended by 2 people · similar by subject and what people say about it
 Information GraphicsRobert L. Harris · 1999 · recommended by 3 people · similar by subject and what people say about it
 Beautiful EvidenceEdward R. Tufte · 2006 · recommended by 8 people · similar by subject and what people say about it
 Say it with chartsGene Zelazny · 2001 · recommended by 3 people · similar by subject and what people say about it
 Interactive Data Visualization For The WebScott Murray · 2013 · recommended by 3 people · similar by subject and what people say about it
 Visual & Statistical ThinkingEdward R. Tufte · 1997 · recommended by 0 people · similar by subject and what people say about it
 Visual Thinking in MathematicsMarcus Giaquinto · 2007 · recommended by 1 person · similar by subject and what people say about it