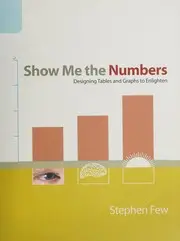
Show Me the Numbers
Stephen Few · 2004
Writing, design and web craft › Data visualization and visual communication
#6,486 most recommended
Hacker News
8
mentions by 5 people · top 35% of 15,732 books
Open Library
4.00★★★★★★★★★★
3 ratings · 19 want to read
Wikipedia
—
No article yet
About the book
A practical guide to presenting quantitative information in tables and graphs, aimed mainly at business analysts and managers who prepare reports and presentations. It covers the principles, choices, and common practices that determine whether numerical data is communicated clearly. Most tables and graphs in business are poorly designed, and the cause is a failure to apply what is known about visual perception and cognition. Effective displays put the reader's need to see patterns and comparisons first, which means choosing the graph type that fits the data's message, removing decoration and non-data ink, and using visual attributes such as position, length, and color deliberately. The book argues that simplicity and restraint in design usually communicate numbers better than ornate or novel formats.
Written by Claude from what it knows of this book.
What Hacker News says 80% recommend · 0% critical
In the commenters’ own words
I would recommend starting with Stephen Few's books: Show Me the Numbers and Information Dashboard Design: Displaying Data for At-a-Glance Monitoring to get…
I would also recommend checking out Stephen Few's books (Information Dashboard Design and/or Show Me the Numbers) for quick and useful guidelines on visually…
What Open Library readers say 4.00 from 3 ratings
- 51
- 41
- 31
- 20
- 10
- 19 want to read
- 2 reading
- 3 have read
Only 3 ratings: treat the average as a hint.
What critics say, via Wikipedia
No Wikipedia article about this book yet, so no critics to quote.
Reddit communities — coming later
The threads it came up in
Details
- First published
- 2004
- ISBN
- 9780970601995
- Editions known
- 2 at Open Library
- Open Library
- OL8167543W
Business presentationsCharts, diagramsGraphic methods
Read next: its neighbours on the mosaic
 Information Dashboard DesignStephen Few · 2006 · recommended by 25 people · 3 people recommended both
 Now you see itStephen Few · 2009 · recommended by 2 people · similar by subject and what people say about it
 The Visual Display of Quantitative InformationEdward R. Tufte · 1983 · recommended by 100 people · similar by subject and what people say about it
 Envisioning InformationEdward R. Tufte · 1990 · recommended by 31 people · similar by subject and what people say about it
 Good chartsScott Berinato · 2016 · recommended by 1 person · similar by subject and what people say about it
 Visual ExplanationsEdward R. Tufte · 1997 · recommended by 11 people · similar by subject and what people say about it
 Say it with chartsGene Zelazny · 2001 · recommended by 3 people · similar by subject and what people say about it
 How Charts LieAlberto Cairo · 2019 · recommended by 5 people · similar by subject and what people say about it
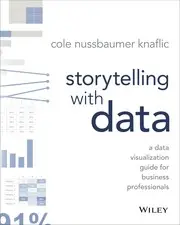 Storytelling with DataCole Nussbaumer Knaflic · 2015 · recommended by 6 people · similar by subject and what people say about it
 Beautiful EvidenceEdward R. Tufte · 2006 · recommended by 8 people · similar by subject and what people say about it
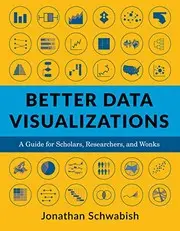 Better Data Visualizations - a Guide for Scholars, Researchers, and WonksJonathan A. Schwabish · 2021 · recommended by 2 people · similar by subject and what people say about it
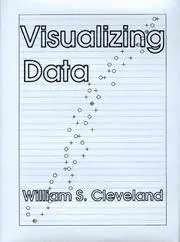 Visualizing dataWilliam S. Cleveland · 1993 · recommended by 2 people · similar by subject and what people say about it
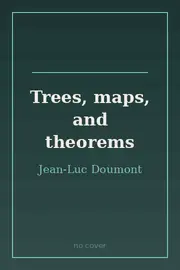 Trees, maps, and theoremsJean-Luc Doumont · 2009 · recommended by 3 people · similar by subject and what people say about it
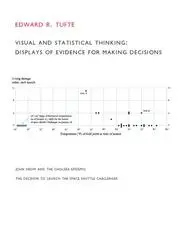 Visual & Statistical ThinkingEdward R. Tufte · 1997 · recommended by 0 people · similar by subject and what people say about it
 How To Lie With ChartsGerald Everett Jones · 2000 · recommended by 1 person · similar by subject and what people say about it
 Applied mathematics for database professionalsLex de Haan · 2007 · recommended by 5 people · loosely similar by subject
 The Wall Street journal guide to information graphicsDona M. Wong · 2010 · recommended by 4 people · similar by subject and what people say about it
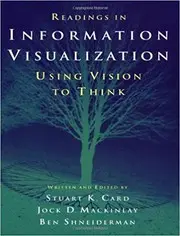 Readings in information visualizationStuart K. Card · 1999 · recommended by 2 people · similar by subject and what people say about it
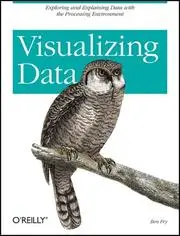 Visualizing DataBen Fry · 2008 · recommended by 7 people · similar by subject and what people say about it
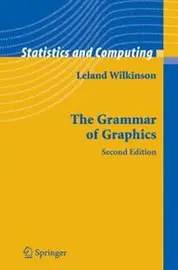 The grammar of graphicsLeland Wilkinson · 1999 · recommended by 16 people · similar by subject and what people say about it
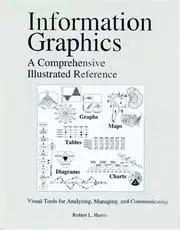 Information GraphicsRobert L. Harris · 1999 · recommended by 3 people · similar by subject and what people say about it
 Images of organizationGareth Morgan · 1986 · recommended by 5 people · loosely similar by subject
 Presentation patternsNeal Ford · 2012 · recommended by 2 people · similar by subject and what people say about it
 Information is BeautifulDavid McCandless · 2010 · recommended by 0 people · similar by subject and what people say about it