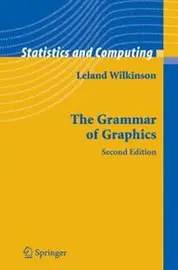
The grammar of graphics
Leland Wilkinson, D. Rope · 1999
Writing, design and web craft › Data visualization and visual communication
#890 most recommended
Hacker News
55
mentions by 47 people · top 6% of 15,732 books
Open Library
4.50★★★★★★★★★★
2 ratings · 5 want to read
Wikipedia
—
No article yet
About the book
The subject is the formal structure behind quantitative graphics: how a chart is produced from data, and what rules connect pie charts, bar charts, scatterplots, function plots, maps, mosaics, and radar charts. Its scope is mainly static statistical graphics, with the emphasis on underlying structure rather than on any one software package, though it includes many color examples of what the system can produce. The central claim is that almost any quantitative graphic can be generated from a small set of composable components, such as variables, algebraic combinations of them, scales, coordinate systems, geometric elements, and statistical transformations, so that the graphic is a mapping from data to visual forms governed by explicit rules. Wilkinson presents this as a grammar in the sense of a formal language, comparable to what probability theory provides for statistics. The argument is that naming and specifying these parts makes chart types derivable rather than a fixed catalogue, which supports building graphics systems on that foundation.
Written by Claude from what it knows of this book.
What Hacker News says 34% recommend · 2% critical
In the commenters’ own words
I'll give you a couple. Note that some of these are rehashes of my earlier comments. # Elements of Programming…
You might find it helpful to distinguish between visualizing the design of the system being implemented by your software, visualizing protocols being…
What Open Library readers say 4.50 from 2 ratings
- 51
- 41
- 30
- 20
- 10
- 5 want to read
- 0 reading
- 3 have read
Only 2 ratings: treat the average as a hint.
What critics say, via Wikipedia
No Wikipedia article about this book yet, so no critics to quote.
Reddit communities — coming later
The threads it came up in
Details
- First published
- 1999
- ISBN
- 9780387245447
- Editions known
- 10 at Open Library
- Open Library
- OL16964990W
Computer graphicsComputer visionData processingDataprocessingDatenanalyseGrafische methodenGraphic methodsGraphische DarstellungGraphische ProgrammierungMathematical statisticsObjektorientierte AnalyseStatisticsStatistics and Computing/Statistics ProgramsStatistics, data processing
Read next: its neighbours on the mosaic
 Ggplot2Hadley Wickham · 2009 · recommended by 5 people · named together in 2 comments
 Visualization Analysis and DesignTamara Munzner · 2014 · recommended by 6 people · similar by subject and what people say about it
 R for Data ScienceHadley Wickham · 2017 · recommended by 40 people · 3 people recommended both
 Visualizing DataBen Fry · 2008 · recommended by 7 people · similar by subject and what people say about it
 Storytelling with DataCole Nussbaumer Knaflic · 2015 · recommended by 6 people · similar by subject and what people say about it
 The Elements of Statistical LearningTrevor Hastie · 2001 · recommended by 144 people · 3 people recommended both
 The Visual Display of Quantitative InformationEdward R. Tufte · 1983 · recommended by 100 people · similar by subject and what people say about it
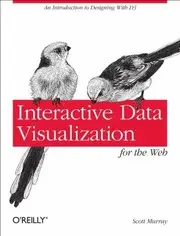 Interactive Data Visualization For The WebScott Murray · 2013 · recommended by 3 people · similar by subject and what people say about it
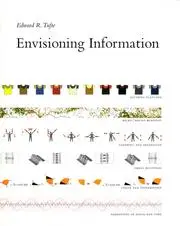 Envisioning InformationEdward R. Tufte · 1990 · recommended by 31 people · similar by subject and what people say about it
 Computer graphicsJohn F. Hughes · 1995 · recommended by 11 people · similar by subject and what people say about it
 How to Design ProgramsMatthias Felleisen · 2001 · recommended by 277 people · 3 people recommended both
 Visual complex analysisTristan Needham · 1997 · recommended by 38 people · similar by subject and what people say about it
 Visual ExplanationsEdward R. Tufte · 1997 · recommended by 11 people · similar by subject and what people say about it
 The elements of graphing dataWilliam S. Cleveland · 1985 · recommended by 6 people · similar by subject and what people say about it
 Visual grammarChristian Leborg · 2006 · recommended by 6 people · similar by subject and what people say about it
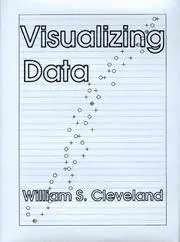 Visualizing dataWilliam S. Cleveland · 1993 · recommended by 2 people · similar by subject and what people say about it
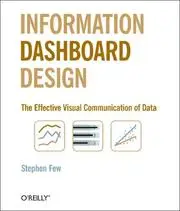 Information Dashboard DesignStephen Few · 2006 · recommended by 25 people · similar by subject and what people say about it
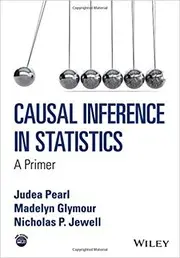 Causal Inference in StatisticsJudea Pearl · 2016 · recommended by 5 people · 2 people recommended both
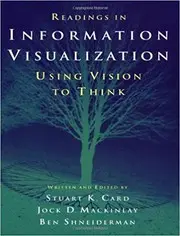 Readings in information visualizationStuart K. Card · 1999 · recommended by 2 people · similar by subject and what people say about it
 The cartoon guide to statisticsLarry Gonick · 1993 · recommended by 17 people · similar by subject and what people say about it
 How to Lie with StatisticsDarrell Huff · 1954 · recommended by 63 people · similar by subject and what people say about it
 Probabilistic Graphical ModelsDaphne Koller · 2009 · recommended by 16 people · similar by subject and what people say about it
 Good chartsScott Berinato · 2016 · recommended by 1 person · similar by subject and what people say about it
 Beautiful EvidenceEdward R. Tufte · 2006 · recommended by 8 people · similar by subject and what people say about it