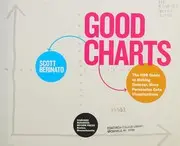
Good charts
Scott Berinato · 2016
Writing, design and web craft › Data visualization and visual communication
#14,186 most recommended
Hacker News
2
mentions by 2 people · top 79% of 15,732 books
Open Library
4.00★★★★★★★★★★
1 rating · 13 want to read
Wikipedia
—
No article yet
About the book
A guide for managers and other non-specialists on making charts that communicate ideas rather than merely display data. It covers how to plan a visualization before building it, through talking, sketching, and prototyping, and how to choose and shape charts for business audiences. Charts are a language that shapes how people understand and act on ideas, so the choice of visual form matters as much as the data. Berinato contends that most business charts are poor because they are default spreadsheet output, and that a deliberate process can produce charts that are clearer and more persuasive. He draws on research in visual perception and visualization science to explain why some charts produce an immediate sense of understanding and others do not.
Written by Claude from what it knows of this book.
What Hacker News says 50% recommend · 0% critical
In the commenters’ own words
I've been learning this stuff for work some. I've found that Good Charts: The HBR Guide to making Smarter More Persuasive Data Visualizations[1] to be…
I'm reading the book Good Charts ( https://hbr.org/product/good-charts-the-hbr-guide-to-making-... ) and it talked about (and linked) your paper. I found it…
What Open Library readers say 4.00 from 1 rating
- 50
- 41
- 30
- 20
- 10
- 13 want to read
- 1 reading
- 2 have read
Only 1 rating: treat the average as a hint.
What critics say, via Wikipedia
No Wikipedia article about this book yet, so no critics to quote.
Reddit communities — coming later
Details
- First published
- 2016
- ISBN
- 9781633690707
- Editions known
- 2 at Open Library
- Open Library
- OL20039865W
Audio-visual aidsBUSINESS & ECONOMICSBUSINESS & ECONOMICS / Business Communication / GeneralBUSINESS & ECONOMICS / Business Communication / Meetings & PresentationsBUSINESS & ECONOMICS / Industrial ManagementBUSINESS & ECONOMICS / ManagementBUSINESS & ECONOMICS / Management ScienceBUSINESS & ECONOMICS / Organizational BehaviorBUSINESS & ECONOMICS / Strategic PlanningBusiness CommunicationBusiness presentationsCharts, diagramsCommunication en gestionCommunication in management
Read next: its neighbours on the mosaic
 R for Data ScienceHadley Wickham · 2017 · recommended by 40 people · similar by subject and what people say about it
 Storytelling with DataCole Nussbaumer Knaflic · 2015 · recommended by 6 people · similar by subject and what people say about it
 How Charts LieAlberto Cairo · 2019 · recommended by 5 people · similar by subject and what people say about it
 The Wall Street journal guide to information graphicsDona M. Wong · 2010 · recommended by 4 people · similar by subject and what people say about it
 Say it with chartsGene Zelazny · 2001 · recommended by 3 people · similar by subject and what people say about it
 Better Data Visualizations - a Guide for Scholars, Researchers, and WonksJonathan A. Schwabish · 2021 · recommended by 2 people · similar by subject and what people say about it
 Interactive Data Visualization For The WebScott Murray · 2013 · recommended by 3 people · similar by subject and what people say about it
 The grammar of graphicsLeland Wilkinson · 1999 · recommended by 16 people · similar by subject and what people say about it
 Show Me the NumbersStephen Few · 2004 · recommended by 4 people · similar by subject and what people say about it
 The Visual Display of Quantitative InformationEdward R. Tufte · 1983 · recommended by 100 people · similar by subject and what people say about it
 Information GraphicsRobert L. Harris · 1999 · recommended by 3 people · similar by subject and what people say about it
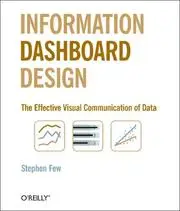 Information Dashboard DesignStephen Few · 2006 · recommended by 25 people · similar by subject and what people say about it
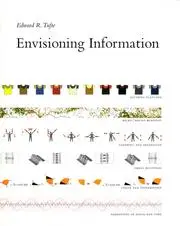 Envisioning InformationEdward R. Tufte · 1990 · recommended by 31 people · similar by subject and what people say about it
 Readings in information visualizationStuart K. Card · 1999 · recommended by 2 people · similar by subject and what people say about it
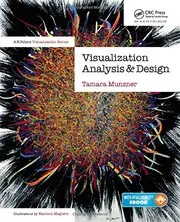 Visualization Analysis and DesignTamara Munzner · 2014 · recommended by 6 people · similar by subject and what people say about it
 Presentation ZenGarr Reynolds · 2007 · recommended by 18 people · similar by subject and what people say about it
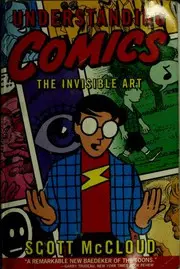 Understanding ComicsScott McCloud · 1993 · recommended by 56 people · similar by subject and what people say about it
 Now you see itStephen Few · 2009 · recommended by 2 people · similar by subject and what people say about it
 Visual thinking for designColin Ware · 2008 · recommended by 2 people · similar by subject and what people say about it
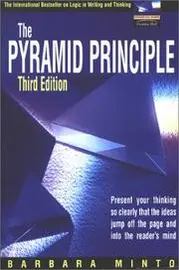 The pyramid principleBarbara Minto · 1978 · recommended by 28 people · similar by subject and what people say about it
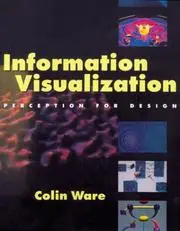 Information visualizationColin Ware · 2000 · recommended by 3 people · similar by subject and what people say about it
 Data SmartJohn W. Foreman · 2013 · recommended by 20 people · similar by subject and what people say about it
 Making Things HappenScott Berkun · 2008 · recommended by 10 people · similar by subject and what people say about it
 Visualizing DataBen Fry · 2008 · recommended by 7 people · similar by subject and what people say about it