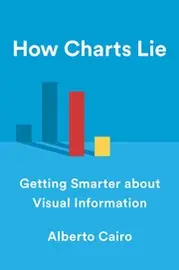
How Charts Lie
Alberto Cairo · 2019
Writing, design and web craft › Data visualization and visual communication
#7,456 most recommended
Hacker News
5
mentions by 5 people · top 48% of 15,732 books
Open Library
4.00★★★★★★★★★★
1 rating · 9 want to read
Wikipedia
—
No article yet
About the book
How Charts Lie examines how charts, infographics, maps, and diagrams shape what readers take to be true, covering both their power to inform and their capacity to mislead. Its scope runs from election-result graphics and global GDP maps to box-office charts and the hurricane "eye of the storm" maps on television, with particular attention to how such visuals circulate on social media. Alberto Cairo contends that visualizations feel objective and so can persuade more effectively than text, even when they omit data, use inaccurate figures, suggest patterns the data does not support, or are simply poorly designed. He holds that many people lack the skills to read these visuals critically, which leaves them open to manipulation by politicians, journalists, advertisers, and employers. The book's remedy is to teach readers to examine a chart's sources, choices of scale and axes, color, and what it leaves out, so they can use visual information to understand public debates driven by numbers.
Written by Claude from what it knows of this book.
What Hacker News says 100% recommend · 0% critical
In the commenters’ own words
I'd actually recommend some excellent books on the "philosophy" of data presentation: The first that comes to mind is "the visual display of quantitative…
I went through my recent-books shelves and found a few shorter books that are well worth reading. Short books for developers are rare these days. Algorithms…
What Open Library readers say 4.00 from 1 rating
- 50
- 41
- 30
- 20
- 10
- 9 want to read
- 0 reading
- 1 have read
Only 1 rating: treat the average as a hint.
What critics say, via Wikipedia
No Wikipedia article about this book yet, so no critics to quote.
Reddit communities — coming later
The threads it came up in
Details
- First published
- 2019
- ISBN
- 9781324001560
- Editions known
- 6 at Open Library
- Open Library
- OL20638164W
ChartsCharts, diagramsComputer graphicsDesignInformation visualizationSocial mediaTechnologyVisual communication
Read next: its neighbours on the mosaic
 Algorithms unlockedThomas H. Cormen · 2013 · recommended by 7 people · similar by subject and what people say about it
 The Art of Readable CodeDustin Boswell · 2011 · recommended by 11 people · similar by subject and what people say about it
 The Visual Display of Quantitative InformationEdward R. Tufte · 1983 · recommended by 100 people · similar by subject and what people say about it
 How to Write a ThesisUmberto Eco · 2015 · recommended by 9 people · similar by subject and what people say about it
 Everybody LiesSeth Stephens-Davidowitz · 2017 · recommended by 9 people · similar by subject and what people say about it
 Effective DebuggingDiomidis Spinellis · 2016 · recommended by 2 people · loosely similar by subject
 Envisioning InformationEdward R. Tufte · 1990 · recommended by 31 people · similar by subject and what people say about it
 Storytelling with DataCole Nussbaumer Knaflic · 2015 · recommended by 6 people · similar by subject and what people say about it
 How To Lie With ChartsGerald Everett Jones · 2000 · recommended by 1 person · similar by subject and what people say about it
 Good chartsScott Berinato · 2016 · recommended by 1 person · similar by subject and what people say about it
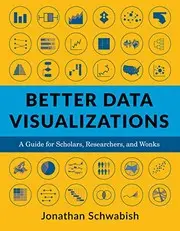 Better Data Visualizations - a Guide for Scholars, Researchers, and WonksJonathan A. Schwabish · 2021 · recommended by 2 people · similar by subject and what people say about it
 The grammar of graphicsLeland Wilkinson · 1999 · recommended by 16 people · similar by subject and what people say about it
 Visual ExplanationsEdward R. Tufte · 1997 · recommended by 11 people · similar by subject and what people say about it
 The Functional ArtAlberto Cairo · 2012 · recommended by 1 person · similar by subject and what people say about it
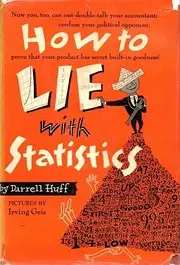 How to Lie with StatisticsDarrell Huff · 1954 · recommended by 63 people · similar by subject and what people say about it
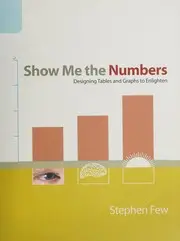 Show Me the NumbersStephen Few · 2004 · recommended by 4 people · similar by subject and what people say about it
 Now you see itStephen Few · 2009 · recommended by 2 people · similar by subject and what people say about it
 Information is BeautifulDavid McCandless · 2010 · recommended by 0 people · similar by subject and what people say about it
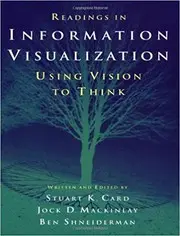 Readings in information visualizationStuart K. Card · 1999 · recommended by 2 people · similar by subject and what people say about it
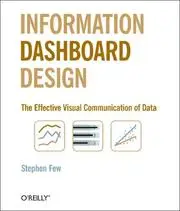 Information Dashboard DesignStephen Few · 2006 · recommended by 25 people · similar by subject and what people say about it
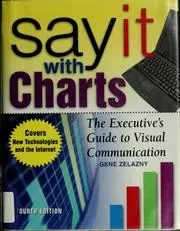 Say it with chartsGene Zelazny · 2001 · recommended by 3 people · similar by subject and what people say about it
 Beautiful EvidenceEdward R. Tufte · 2006 · recommended by 8 people · similar by subject and what people say about it
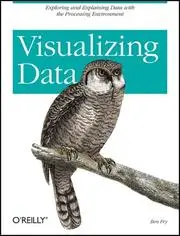 Visualizing DataBen Fry · 2008 · recommended by 7 people · similar by subject and what people say about it
 The elements of graphing dataWilliam S. Cleveland · 1985 · recommended by 6 people · similar by subject and what people say about it