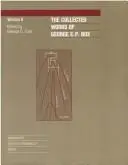
The elements of graphing data
William S. Cleveland · 1985
Writing, design and web craft › Data visualization and visual communication
#5,366 most recommended
Hacker News
8
mentions by 7 people · top 35% of 15,732 books
Open Library
4.50★★★★★★★★★★
2 ratings · 4 want to read
Wikipedia
—
No article yet
About the book
A guide to constructing graphs of quantitative data, covering the choice of graph types, scales, aspect ratios, labels, and the display of one or several variables at a time. It is aimed at people who make statistical and scientific charts and treats graphing as a method for communicating numerical information. Graphs should be designed around how people visually decode quantities, so the choice of encoding matters. The book draws on perceptual experiments to rank how accurately readers judge position, length, angle, and area, and concludes that position along a common scale is the most reliable. It recommends graph forms that exploit this, and it criticizes elaborate or decorative designs that make values harder to read.
Written by Claude from what it knows of this book.
What Hacker News says 86% recommend · 0% critical
In the commenters’ own words
Largely for historical reasons, I mostly use R. It requires a lot of care & feeding, but rewards you with a lot of control. A colleague uses MatPlotLib under…
Depends on the data sets you want to work with. For straight-up linear regression, with a heavy emphasis on observational data appropriate for…
What Open Library readers say 4.50 from 2 ratings
- 51
- 41
- 30
- 20
- 10
- 4 want to read
- 0 reading
- 2 have read
Only 2 ratings: treat the average as a hint.
What critics say, via Wikipedia
No Wikipedia article about this book yet, so no critics to quote.
Reddit communities — coming later
The threads it came up in
Details
- First published
- 1985
- ISBN
- 9780963488411
- Editions known
- 4 at Open Library
- Open Library
- OL3540895W
Computer graphicsGraphic methods
Read next: its neighbours on the mosaic
 Visualizing dataWilliam S. Cleveland · 1993 · recommended by 2 people · similar by subject and what people say about it
 Visualizing DataBen Fry · 2008 · recommended by 7 people · similar by subject and what people say about it
 Introductory EconometricsJeffrey M. Wooldridge · 2015 · recommended by 6 people · loosely similar by subject
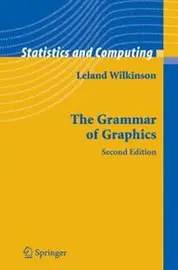 The grammar of graphicsLeland Wilkinson · 1999 · recommended by 16 people · similar by subject and what people say about it
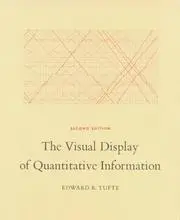 The Visual Display of Quantitative InformationEdward R. Tufte · 1983 · recommended by 100 people · similar by subject and what people say about it
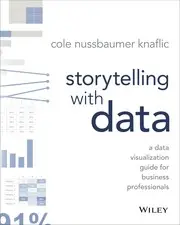 Storytelling with DataCole Nussbaumer Knaflic · 2015 · recommended by 6 people · similar by subject and what people say about it
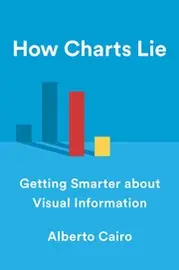 How Charts LieAlberto Cairo · 2019 · recommended by 5 people · similar by subject and what people say about it
 StatisticsDavid Freedman · 1978 · recommended by 11 people · loosely similar by subject
 Readings in information visualizationStuart K. Card · 1999 · recommended by 2 people · similar by subject and what people say about it
 The art of R programmingNorman S. Matloff · 2011 · recommended by 8 people · loosely similar by subject
 The Functional ArtAlberto Cairo · 2012 · recommended by 1 person · similar by subject and what people say about it
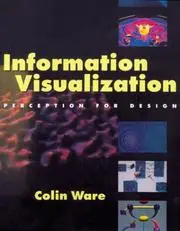 Information visualizationColin Ware · 2000 · recommended by 3 people · similar by subject and what people say about it
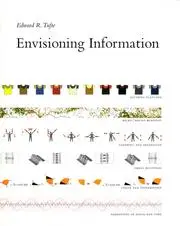 Envisioning InformationEdward R. Tufte · 1990 · recommended by 31 people · similar by subject and what people say about it
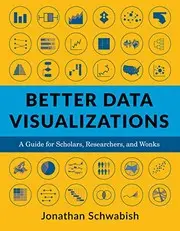 Better Data Visualizations - a Guide for Scholars, Researchers, and WonksJonathan A. Schwabish · 2021 · recommended by 2 people · similar by subject and what people say about it
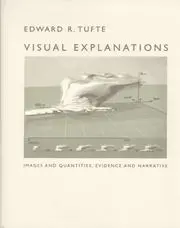 Visual ExplanationsEdward R. Tufte · 1997 · recommended by 11 people · similar by subject and what people say about it
 Good chartsScott Berinato · 2016 · recommended by 1 person · similar by subject and what people say about it
 How To Lie With ChartsGerald Everett Jones · 2000 · recommended by 1 person · similar by subject and what people say about it
 Information GraphicsRobert L. Harris · 1999 · recommended by 3 people · similar by subject and what people say about it
 Now you see itStephen Few · 2009 · recommended by 2 people · similar by subject and what people say about it
 Linear algebra problem bookPaul R. Halmos · 1995 · recommended by 1 person · loosely similar by subject
 Functions and graphsIsrael M. Gel'fand · 1969 · recommended by 4 people · similar by subject and what people say about it
 Interactive Data Visualization For The WebScott Murray · 2013 · recommended by 3 people · similar by subject and what people say about it
 Information Dashboard DesignStephen Few · 2006 · recommended by 25 people · similar by subject and what people say about it
 Show Me the NumbersStephen Few · 2004 · recommended by 4 people · similar by subject and what people say about it