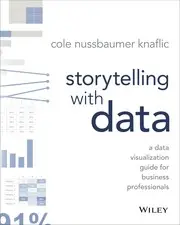
Storytelling with Data
Cole Nussbaumer Knaflic · 2015
Writing, design and web craft › Data visualization and visual communication
#5,495 most recommended
Hacker News
7
mentions by 7 people · top 38% of 15,732 books
Open Library
4.57★★★★★★★★★★
7 ratings · 250 want to read
Wikipedia
—
No article yet
About the book
Storytelling with Data is a practical guide to designing charts and presentations that communicate a specific point to an audience. It covers the fundamentals of data visualization, from choosing a chart type to removing clutter and directing attention, with before-and-after makeovers of real-world graphs. It is aimed mainly at people who present data to business audiences. Good data communication depends on storytelling, meaning a clear message, context, and an audience-focused narrative, not just displaying numbers. Charts should be built around the point they make, and extraneous elements such as heavy gridlines, redundant labels, and decorative effects should be stripped away so attention lands on what matters. Visual attributes like color, position, and emphasis should be used deliberately to guide the viewer's eye. The author maintains that these habits can be learned and applied to any graph or presentation.
Written by Claude from what it knows of this book.
What Hacker News says 86% recommend · 0% critical
In the commenters’ own words
Neat! Really clever simplicity on how you added gradients. This is one of my favorite spaces, so I'll add some generic advice which may or may not be helpful…
Tufte is a waste of time unless you’re interested in history of dataviz. While he makes excellent points on the graphics of the time, he makes at least an…
What Open Library readers say 4.57 from 7 ratings
- 55
- 41
- 31
- 20
- 10
- 250 want to read
- 15 reading
- 7 have read
Only 7 ratings: treat the average as a hint.
What critics say, via Wikipedia
No Wikipedia article about this book yet, so no critics to quote.
Reddit communities — coming later
The threads it came up in
Details
- First published
- 2015
- ISBN
- 9781978614277
- Editions known
- 22 at Open Library
- Open Library
- OL17659741W
AppliedBusinessBusiness & economics -> business communication -> oral communicationBusiness communicationBusiness presentationsCommunicationComputer ScienceComputer graphicsDesignEnglish & college success -> english -> professional & technical communicationGeneralInformation visualizationMa22Mathematics & statistics -> mathematics -> mathematics general
Read next: its neighbours on the mosaic
 Better Data Visualizations - a Guide for Scholars, Researchers, and WonksJonathan A. Schwabish · 2021 · recommended by 2 people · similar by subject and what people say about it
 The grammar of graphicsLeland Wilkinson · 1999 · recommended by 16 people · similar by subject and what people say about it
 The Visual Display of Quantitative InformationEdward R. Tufte · 1983 · recommended by 100 people · similar by subject and what people say about it
 The Art of StatisticsDavid Spiegelhalter · 2019 · recommended by 7 people · similar by subject and what people say about it
 How Charts LieAlberto Cairo · 2019 · recommended by 5 people · similar by subject and what people say about it
 Good chartsScott Berinato · 2016 · recommended by 1 person · similar by subject and what people say about it
 R for Data ScienceHadley Wickham · 2017 · recommended by 40 people · similar by subject and what people say about it
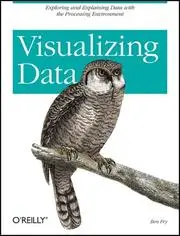 Visualizing DataBen Fry · 2008 · recommended by 7 people · similar by subject and what people say about it
 Now you see itStephen Few · 2009 · recommended by 2 people · similar by subject and what people say about it
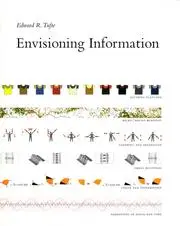 Envisioning InformationEdward R. Tufte · 1990 · recommended by 31 people · similar by subject and what people say about it
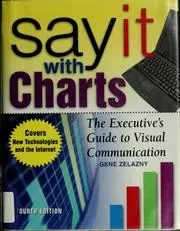 Say it with chartsGene Zelazny · 2001 · recommended by 3 people · similar by subject and what people say about it
 Hands-On Machine Learning with Scikit-Learn, Keras, and TensorFlowAurélien Géron · 2019 · recommended by 8 people · loosely similar by subject
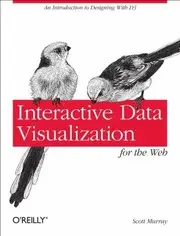 Interactive Data Visualization For The WebScott Murray · 2013 · recommended by 3 people · similar by subject and what people say about it
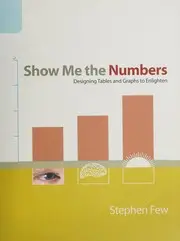 Show Me the NumbersStephen Few · 2004 · recommended by 4 people · similar by subject and what people say about it
 Readings in information visualizationStuart K. Card · 1999 · recommended by 2 people · similar by subject and what people say about it
 Visualization Analysis and DesignTamara Munzner · 2014 · recommended by 6 people · similar by subject and what people say about it
 Visualizing dataWilliam S. Cleveland · 1993 · recommended by 2 people · similar by subject and what people say about it
 The elements of graphing dataWilliam S. Cleveland · 1985 · recommended by 6 people · similar by subject and what people say about it
 Information GraphicsRobert L. Harris · 1999 · recommended by 3 people · similar by subject and what people say about it
 The Wall Street journal guide to information graphicsDona M. Wong · 2010 · recommended by 4 people · similar by subject and what people say about it
 Confessions of a public speakerScott Berkun · 2009 · recommended by 7 people · loosely similar by subject
 Slide:ologyNancy Duarte · 2008 · recommended by 7 people · similar by subject and what people say about it
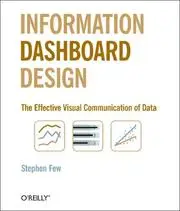 Information Dashboard DesignStephen Few · 2006 · recommended by 25 people · similar by subject and what people say about it
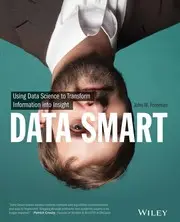 Data SmartJohn W. Foreman · 2013 · recommended by 20 people · similar by subject and what people say about it