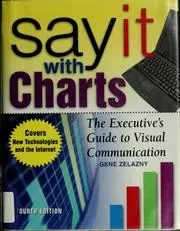
Say it with charts
Gene Zelazny · 2001
Writing, design and web craft › Data visualization and visual communication
#10,260 most recommended
Hacker News
3
mentions by 3 people · top 64% of 15,732 books
Open Library
—
No ratings yet
3 want to read
Wikipedia
—
No article yet
About the book
A practical guide to business graphics: how to turn data and ideas into charts, tables, and visuals for presentations and reports. It covers choosing the chart type, building the graphic, and presenting it, and its updated edition adds guidance on producing the same visuals with computer software. Charts should be built around a single message that the audience can grasp at a glance, and the choice of chart type should follow from what that message is, such as comparison, composition, trend, or relationship. Clarity comes from removing clutter and decoration, and using color and emphasis deliberately to direct the viewer's attention. The book treats visual communication as a skill to be planned for a specific audience, not as a finishing touch added after the content is written.
Written by Claude from what it knows of this book.
What Hacker News says 100% recommend · 0% critical
In the commenters’ own words
This guide is nicely written, and mostly useful for tips on labelling, but some of the advice on choosing chart types is bad. There are several examples of…
In addition to a lot of the recos here, Gene Zelazny's "Say it with charts" is an old school book that a manager of mine had us read in concert with Tufte…
What Open Library readers say
No Open Library reader has rated it yet.
- 3 want to read
- 0 reading
- 0 have read
What critics say, via Wikipedia
No Wikipedia article about this book yet, so no critics to quote.
Reddit communities — coming later
The threads it came up in
Details
- First published
- 2001
- ISBN
- 9780071369978
- Editions known
- 2 at Open Library
- Open Library
- OL16069643W
BeeldcommunicatieBusiness &economicsBusiness communicationBusiness presentationsGrafische voorstellingenGraphic methodsPresentatie
Read next: its neighbours on the mosaic
 Good chartsScott Berinato · 2016 · recommended by 1 person · similar by subject and what people say about it
 Storytelling with DataCole Nussbaumer Knaflic · 2015 · recommended by 6 people · similar by subject and what people say about it
 Show Me the NumbersStephen Few · 2004 · recommended by 4 people · similar by subject and what people say about it
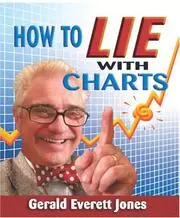 How To Lie With ChartsGerald Everett Jones · 2000 · recommended by 1 person · similar by subject and what people say about it
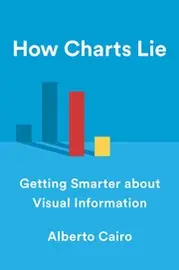 How Charts LieAlberto Cairo · 2019 · recommended by 5 people · similar by subject and what people say about it
 The Visual Display of Quantitative InformationEdward R. Tufte · 1983 · recommended by 100 people · similar by subject and what people say about it
 Visual language for designersConnie Malamed · 2009 · recommended by 2 people · similar by subject and what people say about it
 The grammar of graphicsLeland Wilkinson · 1999 · recommended by 16 people · similar by subject and what people say about it
 Now you see itStephen Few · 2009 · recommended by 2 people · similar by subject and what people say about it
 Better Data Visualizations - a Guide for Scholars, Researchers, and WonksJonathan A. Schwabish · 2021 · recommended by 2 people · similar by subject and what people say about it
 Slide:ologyNancy Duarte · 2008 · recommended by 7 people · similar by subject and what people say about it
 Presentation patternsNeal Ford · 2012 · recommended by 2 people · similar by subject and what people say about it
 Information GraphicsRobert L. Harris · 1999 · recommended by 3 people · similar by subject and what people say about it
 Visualizing dataWilliam S. Cleveland · 1993 · recommended by 2 people · similar by subject and what people say about it
 Envisioning InformationEdward R. Tufte · 1990 · recommended by 31 people · similar by subject and what people say about it
 Visual ExplanationsEdward R. Tufte · 1997 · recommended by 11 people · similar by subject and what people say about it
 The Back of the NapkinDan Roam · 2008 · recommended by 6 people · similar by subject and what people say about it
 Visual grammarChristian Leborg · 2006 · recommended by 6 people · similar by subject and what people say about it
 Presentation ZenGarr Reynolds · 2007 · recommended by 18 people · similar by subject and what people say about it
 The elements of graphing dataWilliam S. Cleveland · 1985 · recommended by 6 people · similar by subject and what people say about it
 The Wall Street journal guide to information graphicsDona M. Wong · 2010 · recommended by 4 people · similar by subject and what people say about it
 Notes on graphic design and visual communicationGregg Berryman · 1979 · recommended by 2 people · similar by subject and what people say about it
 Trees, maps, and theoremsJean-Luc Doumont · 2009 · recommended by 3 people · similar by subject and what people say about it
 Beyond Bullet PointsCliff Atkinson · 2005 · recommended by 3 people · similar by subject and what people say about it