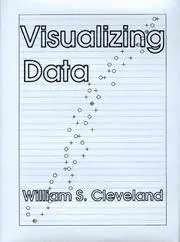
Visualizing data
William S. Cleveland · 1993
Writing, design and web craft › Data visualization and visual communication
#10,945 most recommended
Hacker News
3
mentions by 3 people · top 64% of 15,732 books
Open Library
4.00★★★★★★★★★★
2 ratings · 10 want to read
Wikipedia
—
No article yet
About the book
Graphical methods for analysing and presenting quantitative data, covering how statistical graphs are built, read and used in both exploratory work and communication. It sits at the boundary of statistics, graphic design and visual perception. Graphs are tools for seeing structure, outliers and model failures that summary numbers hide, so their design should follow how people perceive quantities. The book holds that some visual encodings, such as position along a common scale, are decoded more accurately than others, such as angle, area or colour, and that graphs should carry the data rather than decoration. It develops this into specific methods, including the dot plot and Trellis display for comparing many groups at once, and argues for graphical diagnostics as a routine part of data analysis.
Written by Claude from what it knows of this book.
What Hacker News says 67% recommend · 0% critical
In the commenters’ own words
William Cleveland, "Elements of Graphing Data"[1] and "Visualizing Data"[2] Cleveland worked at Bell Labs and his work is timeless and very practical. It…
If you're looking for a more quantitative version of Tufte, I highly recommend Cleveland ( http://www.amazon.com/Visualizing-Data-William-S-Cleveland/d... )…
What Open Library readers say 4.00 from 2 ratings
- 50
- 42
- 30
- 20
- 10
- 10 want to read
- 2 reading
- 1 have read
Only 2 ratings: treat the average as a hint.
What critics say, via Wikipedia
No Wikipedia article about this book yet, so no critics to quote.
Reddit communities — coming later
The threads it came up in
Details
- First published
- 1993
- ISBN
- 9780963488404
- Editions known
- 2 at Open Library
- Open Library
- OL3540894W
Graphic methodsMathematical statistics
Read next: its neighbours on the mosaic
 The elements of graphing dataWilliam S. Cleveland · 1985 · recommended by 6 people · similar by subject and what people say about it
 The Visual Display of Quantitative InformationEdward R. Tufte · 1983 · recommended by 100 people · similar by subject and what people say about it
 The grammar of graphicsLeland Wilkinson · 1999 · recommended by 16 people · similar by subject and what people say about it
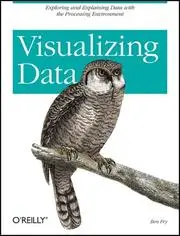 Visualizing DataBen Fry · 2008 · recommended by 7 people · similar by subject and what people say about it
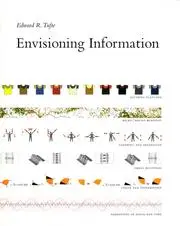 Envisioning InformationEdward R. Tufte · 1990 · recommended by 31 people · similar by subject and what people say about it
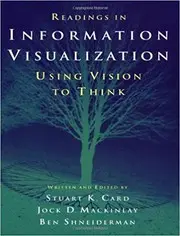 Readings in information visualizationStuart K. Card · 1999 · recommended by 2 people · similar by subject and what people say about it
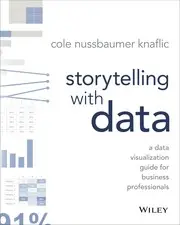 Storytelling with DataCole Nussbaumer Knaflic · 2015 · recommended by 6 people · similar by subject and what people say about it
 Show Me the NumbersStephen Few · 2004 · recommended by 4 people · similar by subject and what people say about it
 Visual ExplanationsEdward R. Tufte · 1997 · recommended by 11 people · similar by subject and what people say about it
 Better Data Visualizations - a Guide for Scholars, Researchers, and WonksJonathan A. Schwabish · 2021 · recommended by 2 people · similar by subject and what people say about it
 Visual & Statistical ThinkingEdward R. Tufte · 1997 · recommended by 0 people · similar by subject and what people say about it
 How Charts LieAlberto Cairo · 2019 · recommended by 5 people · similar by subject and what people say about it
 Information visualizationColin Ware · 2000 · recommended by 3 people · similar by subject and what people say about it
 Now you see itStephen Few · 2009 · recommended by 2 people · similar by subject and what people say about it
 The Functional ArtAlberto Cairo · 2012 · recommended by 1 person · similar by subject and what people say about it
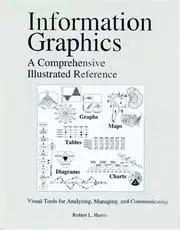 Information GraphicsRobert L. Harris · 1999 · recommended by 3 people · similar by subject and what people say about it
 All of StatisticsLarry Wasserman · 2004 · recommended by 40 people · similar by subject and what people say about it
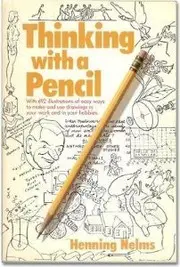 Thinking with a pencilHenning Nelms · 1957 · recommended by 5 people · similar by subject and what people say about it
 Visual thinking for designColin Ware · 2008 · recommended by 2 people · similar by subject and what people say about it
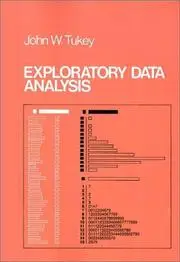 Exploratory data analysisJohn Wilder Tukey · 1970 · recommended by 4 people · similar by subject and what people say about it
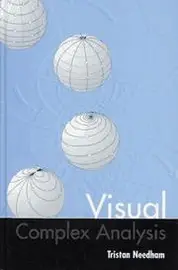 Visual complex analysisTristan Needham · 1997 · recommended by 38 people · similar by subject and what people say about it
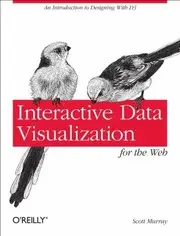 Interactive Data Visualization For The WebScott Murray · 2013 · recommended by 3 people · similar by subject and what people say about it
 Information is BeautifulDavid McCandless · 2010 · recommended by 0 people · similar by subject and what people say about it
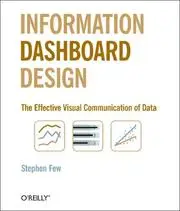 Information Dashboard DesignStephen Few · 2006 · recommended by 25 people · similar by subject and what people say about it