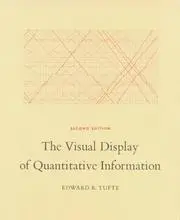
The Visual Display of Quantitative Information
Edward R. Tufte · 1983
Writing, design and web craft › Data visualization and visual communication
#242 most recommended
Hacker News
150
mentions by 138 people · top 2% of 15,732 books
Open Library
4.22★★★★★★★★★★
32 ratings · 227 want to read
Wikipedia
—
No article yet
About the book
The book covers the design of statistical graphics, tables, and maps for presenting quantitative information, including time-series, relational, data map, and multivariate displays. It draws on a large collection of examples, many historical and including the work of William Playfair, and analyzes what makes a display precise and quick to read. Its central claim is that excellent graphics present complex data clearly, precisely, and efficiently, and that the designer's task is to maximize the share of ink that carries data while removing decoration and redundancy, as captured by the data-ink ratio. It also argues that graphics can mislead when design variation is mistaken for data variation, and it offers a measure of distortion (the lie factor) and a catalogue of sources of deception to check against.
Written by Claude from what it knows of this book.
What Hacker News says 72% recommend · 5% critical
In the commenters’ own words
I very much like the aim and contents of this book. There are loads of data visualization basics that this tutorial gets right, like: In bar charts, however…
An alternative approach: – Start by reading "Magic Ink" by Bret Victor: http://worrydream.com/#!/MagicInk – Now you understand that UI design is actually…
What Open Library readers say 4.22 from 32 ratings
- 515
- 410
- 36
- 21
- 10
- 227 want to read
- 10 reading
- 34 have read
What critics say, via Wikipedia
No Wikipedia article about this book yet, so no critics to quote.
Reddit communities — coming later
The threads it came up in
- Ask HN: Books you plan to read in 2020?
- Ask HN: Which books do you consider real gems in your field of work/study?
- Ask HN: What books do you keep on your desk?
- Ask HN: Name 3-5 books that had the most impact on your career and knowledge?
- Ask HN: What three books impacted your career the most?
- Ask HN: Which book or course gave you an unfair advantage?
- Ask HN: Are there any books that inspire or highly influence the way you work?
- Ask HN: I have no commitments for the next 6 months – what books should I read?
Details
- First published
- 1983
- ISBN
- 9780961392147
- Editions known
- 8 at Open Library
- Open Library
- OL2824012W
001.4/226ArtAudio-visual aidsAudiovisual AidsBildesemiologiBusinessCharts, diagramsComputer GraphicsConception assistée par ordinateurDISPLAY DEVICESData DisplayDiagrammEDBEstatistica Descritiva
Read next: its neighbours on the mosaic
 Envisioning InformationEdward R. Tufte · 1990 · recommended by 31 people · 10 people recommended both
 Visual ExplanationsEdward R. Tufte · 1997 · recommended by 11 people · 5 people recommended both
 Readings in information visualizationStuart K. Card · 1999 · recommended by 2 people · 2 people recommended both
 Information Dashboard DesignStephen Few · 2006 · recommended by 25 people · 3 people recommended both
 Beautiful EvidenceEdward R. Tufte · 2006 · recommended by 8 people · 3 people recommended both
 How Charts LieAlberto Cairo · 2019 · recommended by 5 people · similar by subject and what people say about it
 The Elements of Typographic StyleRobert Bringhurst · 1992 · recommended by 85 people · 4 people recommended both
 Storytelling with DataCole Nussbaumer Knaflic · 2015 · recommended by 6 people · similar by subject and what people say about it
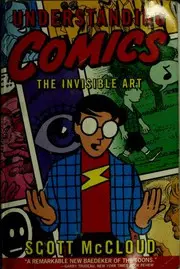 Understanding ComicsScott McCloud · 1993 · recommended by 56 people · 4 people recommended both
 Interaction of colorJosef Albers · 1963 · recommended by 13 people · 2 people recommended both
 Trees, maps, and theoremsJean-Luc Doumont · 2009 · recommended by 3 people · similar by subject and what people say about it
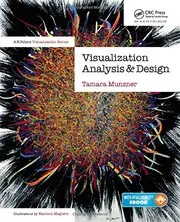 Visualization Analysis and DesignTamara Munzner · 2014 · recommended by 6 people · similar by subject and what people say about it
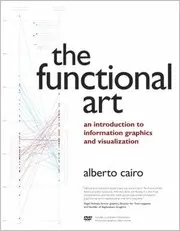 The Functional ArtAlberto Cairo · 2012 · recommended by 1 person · similar by subject and what people say about it
 The grammar of graphicsLeland Wilkinson · 1999 · recommended by 16 people · similar by subject and what people say about it
 Don't Make Me ThinkSteve Krug · 2000 · recommended by 256 people · 5 people recommended both
 Visualizing DataBen Fry · 2008 · recommended by 7 people · similar by subject and what people say about it
 Show Me the NumbersStephen Few · 2004 · recommended by 4 people · similar by subject and what people say about it
 The Wall Street journal guide to information graphicsDona M. Wong · 2010 · recommended by 4 people · similar by subject and what people say about it
 Information GraphicsRobert L. Harris · 1999 · recommended by 3 people · similar by subject and what people say about it
 Universal principles of designWilliam Lidwell · 2010 · recommended by 24 people · 3 people recommended both
 Now you see itStephen Few · 2009 · recommended by 2 people · similar by subject and what people say about it
 Visualizing dataWilliam S. Cleveland · 1993 · recommended by 2 people · similar by subject and what people say about it
 Exploratory data analysisJohn Wilder Tukey · 1970 · recommended by 4 people · similar by subject and what people say about it
 Information visualizationColin Ware · 2000 · recommended by 3 people · similar by subject and what people say about it