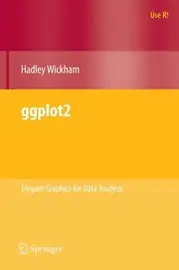
Ggplot2
Hadley Wickham · 2009
Machine learning, statistics and probability › Data science with R and Python
#6,136 most recommended
Hacker News
6
mentions by 6 people · top 42% of 15,732 books
Open Library
4.00★★★★★★★★★★
1 rating · 2 want to read
Wikipedia
—
No article yet
About the book
A reference for ggplot2, the R plotting package, covering how to produce statistical graphics for data analysis. It walks through the package's components, including data, aesthetic mappings, geometric objects, statistical transformations, scales, coordinate systems, and facets, with worked examples throughout. The central claim is that statistical graphics are best built from a small set of independent, composable parts rather than from a catalogue of fixed chart types, following Wilkinson's grammar of graphics. Wickham argues that once a reader understands how layers combine, new plots can be constructed directly from the data and the intended mappings, without searching for a ready-made example. The book presents this layered approach as an aid to exploratory data analysis and to producing clear, reproducible figures in R.
Written by Claude from what it knows of this book.
What Hacker News says 83% recommend · 0% critical
In the commenters’ own words
One of the best all-around plotting packages for R (in my opinion) is Hadley Wickham's ggplot2 . Take a look at the following pages…
> > And it's really hard to beat ggplot. > To be honest, matplotlib seems a good contender to me ( http://matplotlib.org/ ). They're quite different, though…
What Open Library readers say 4.00 from 1 rating
- 50
- 41
- 30
- 20
- 10
- 2 want to read
- 0 reading
- 2 have read
Only 1 rating: treat the average as a hint.
What critics say, via Wikipedia
No Wikipedia article about this book yet, so no critics to quote.
Reddit communities — coming later
The threads it came up in
Details
- First published
- 2009
- ISBN
- 9780387981406
- Editions known
- 4 at Open Library
- Open Library
- OL16595964W
001.4226Computer graphicsDatenanalyseGraphic methodsGraphische DarstellungMathematical statisticsPlot (Graphische Darstellung)Qa90 .w53 2009R (Computer program language)R (Programm)Statistical Theory and MethodsStatisticsVisualisierung
Read next: its neighbours on the mosaic
 The grammar of graphicsLeland Wilkinson · 1999 · recommended by 16 people · named together in 2 comments
 R for Data ScienceHadley Wickham · 2017 · recommended by 40 people · similar by subject and what people say about it
 Advanced RHadley Wickham · 2014 · recommended by 9 people · similar by subject and what people say about it
 Graph drawingGiuseppe Di Battista · 1999 · recommended by 1 person · similar by subject and what people say about it
 Regression and Other StoriesAndrew Gelman · 2020 · recommended by 11 people · similar by subject and what people say about it
 Storytelling with DataCole Nussbaumer Knaflic · 2015 · recommended by 6 people · similar by subject and what people say about it
 Bayesian data analysisAndrew Gelman · 1995 · recommended by 27 people · similar by subject and what people say about it
 The Visual Display of Quantitative InformationEdward R. Tufte · 1983 · recommended by 100 people · similar by subject and what people say about it
 Data Visualization ToolkitBarrett Clark · 2016 · recommended by 2 people · similar by subject and what people say about it
 Visualizing DataBen Fry · 2008 · recommended by 7 people · similar by subject and what people say about it
 Visualizing dataWilliam S. Cleveland · 1993 · recommended by 2 people · similar by subject and what people say about it
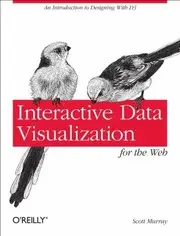 Interactive Data Visualization For The WebScott Murray · 2013 · recommended by 3 people · loosely similar by subject
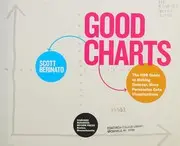 Good chartsScott Berinato · 2016 · recommended by 1 person · loosely similar by subject
 The elements of graphing dataWilliam S. Cleveland · 1985 · recommended by 6 people · loosely similar by subject
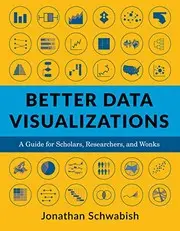 Better Data Visualizations - a Guide for Scholars, Researchers, and WonksJonathan A. Schwabish · 2021 · recommended by 2 people · loosely similar by subject
 Probabilistic Graphical ModelsDaphne Koller · 2009 · recommended by 16 people · loosely similar by subject
 Exploratory data analysisJohn Wilder Tukey · 1970 · recommended by 4 people · loosely similar by subject
 Data analysis using regression and multilevel/hierarchical modelsAndrew Gelman · 2006 · recommended by 10 people · loosely similar by subject
 Causal Inference in StatisticsJudea Pearl · 2016 · recommended by 5 people · loosely similar by subject
 The art of R programmingNorman S. Matloff · 2011 · recommended by 8 people · loosely similar by subject
 An Introduction To Statistical Learning With Applications In RGareth James · 2013 · recommended by 13 people · loosely similar by subject
 R in a nutshellAdler, Joseph M.Eng · 2010 · recommended by 5 people · loosely similar by subject
 Data Science at the Command LineJeroen Janssens · 2014 · recommended by 8 people · loosely similar by subject
 The Wall Street journal guide to information graphicsDona M. Wong · 2010 · recommended by 4 people · loosely similar by subject